Spring 2020 was a challenging season for the tourism industry. The results we were seeing on our website during that time frame were a reflection of the general declines in our industry and an indication that the weeks ahead were going to be a struggle. The results we are seeing so far for the summer, however, show initial signs of recovery.
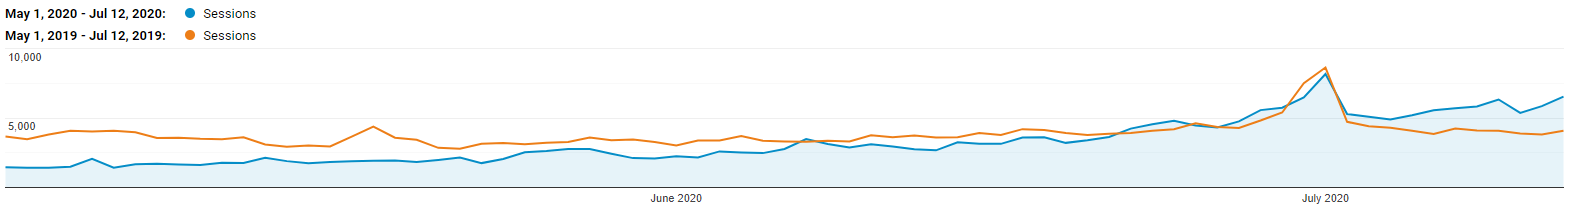
Once BC entered Phase 3 of its Restart Plan and summer officially began, we saw a tipping point where increased website visitation resulted in year-over-year growth. As you will see in the graph below, website sessions started to increase in mid- to late-June. For some days in July, there has been an increase in sessions of more than 50% as compared to 2019. Seeing website results like this is almost unheard of, especially when compared to a record-setting year like 2019. This is a clear indication that people are researching, planning, and visiting Kelowna.
Where is traffic is coming from?
Although international traffic has decreased, Canadian traffic has increased substantially. As provincial health officials encourage BC residents to travel in BC this year, it makes sense that the majority of the traffic growth is coming from within BC. For website sessions by Canadians, 73% of the traffic is from BC, which is up 27% compared to last year.
What does this mean for you?
Since Tourism Kelowna's website is seeing higher volumes of traffic, the potential for visitors to discover your listing, and book with you, increases. This means it is more important than ever to update your listing, not just with new pictures and descriptions, but with the important COVID-19 measures that visitors are looking for. Health and safety are top of mind for everyone, so making sure this information is easily accessible gives visitors the comfort and reassurance that your business is doing all it can to keep customers safe. The booking decision, in turn, is that much easier for the visitor.
How does Kelowna compare to other destinations?
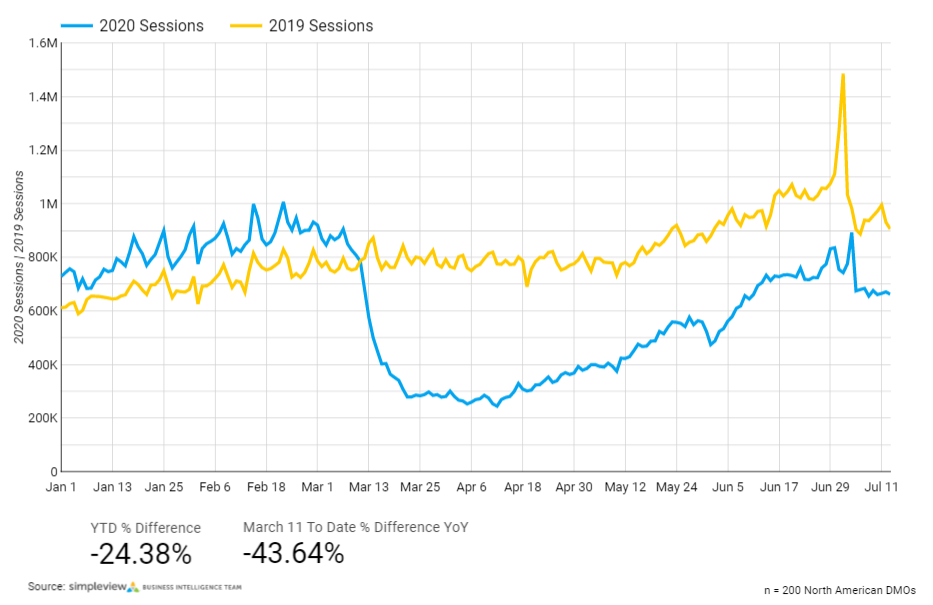
As you can see from the graphs below, North American destination marketing organizations struggled with website visitation in the spring but started to see increases again in April; similar results can be noted with our website. As we move towards July, we can see the year-over-year increases in visitation on our site, whereas other DMOs are still lagging far behind last year.
Tourism Kelowna's Website Data
Website Data from 200 North American Destination Marketing Organizations (DMO)
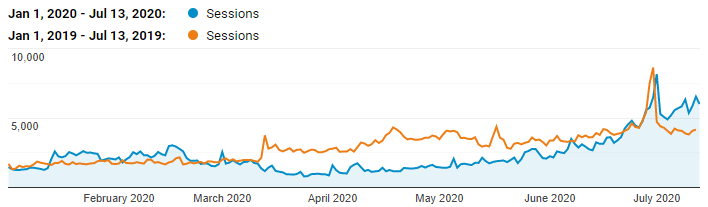
Overall, our website is still down 20% in sessions from January 1 - July 13, 2020, as compared to the same timeframe last year; however, with the recent increases beginning this summer, the outlook is becoming more positive.
If you have any questions or need more information on Tourism Kelowna's website, contact me at steve@tourismkelowna.com or (250) 861-1515 ext. 216.